
US Dollar: Dec ’22 USD is Up at 110.850.
Energies: Dec ’22 Crude is Down at 87.82.
Financials: The Dec ’22 30 Year note is Down 29 ticks and trading at 121.14.
Indices: The Dec ’22 S&P 500 Emini ES contract is 126 ticks Lower and trading at 3788.00.
Gold: The Dec’22 Gold contract is trading Down at 1651.00. Gold is 146 ticks Lower than its close.
Initial conclusion
This is not a correlated market. The dollar is Up, and Crude is Down which is normal, but the 30-year Bond is trading Lower. The Financials should always correlate with the US dollar such that if the dollar is lower, then the bonds should follow and vice-versa. The S&P is Lower, and Crude is trading Lower which is not correlated. Gold is trading Lower which is correlated with the US dollar trading Up. I tend to believe that Gold has an inverse relationship with the US Dollar as when the US Dollar is down, Gold tends to rise in value and vice-versa. Think of it as a seesaw, when one is up the other should be down. I point this out to you to make you aware that when we don’t have a correlated market, it means something is wrong. As traders you need to be aware of this and proceed with your eyes wide open. Currently Asia is trading Lower with the exception of the Singapore and Sensex exchanges. All of Europe is trading Lower at this time.
Possible challenges to traders today
-
Core PCE Price Index is out at 8:30 AM EST. This is Major.
-
Employment Cost Index is out at 8:30 AM EST. Major.
-
Personal Income is out at 8:30 AM EST. This is Major.
-
Personal Spending is out at 8:30 AM EST. This is Major.
-
Pending Home Sales is out at 10 AM EST. Major.
-
Revised UoM Consumer Sentiment is out at 10 AM Major.
-
Revised UoM Consumer Sentiment is out at 10 AM.Major
Treasuries
Traders, please note that we’ve changed the Bond instrument from the 30 year (ZB) to the 10 year (ZN). They work exactly the same.
We’ve elected to switch gears a bit and show correlation between the 10-year bond (ZN) and the S&P futures contract. The S&P contract is the Standard and Poor’s, and the purpose is to show reverse correlation between the two instruments. Remember it’s likened to a seesaw, when up goes up the other should go down and vice versa.
Yesterday the ZN made its move at around 9:45 AM EST. The ZN hit a Low at around that time and the S&P moved Lower shortly thereafter. If you look at the charts below ZN gave a signal at around 9:45 AM and the S&P gave a signal at around the same time. Look at the charts below and you’ll see a pattern for both assets. ZN hit a Low at around 9:45 AM and the S&P moved Lower shortly thereafter. These charts represent the newest version of MultiCharts and I’ve changed the timeframe to a 15-minute chart to display better. This represented a Long opportunity on the 10-year note, as a trader you could have netted about 30 plus ticks per contract on this trade. Each tick is worth $15.625. Please note: the front month for the ZN is now Dec ’22. The S&P contract is also Dec’ 22. I’ve changed the format to Renko Bars such that it may be more apparent and visible.
Charts courtesy of MultiCharts built on an AMP platform
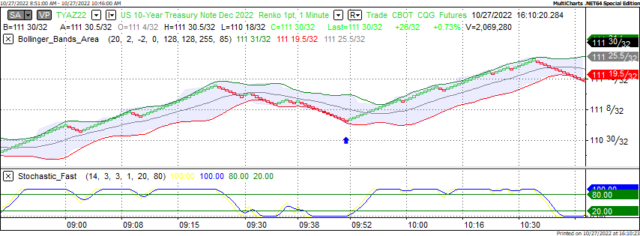
ZN – Dec 2022 – 10/27/22
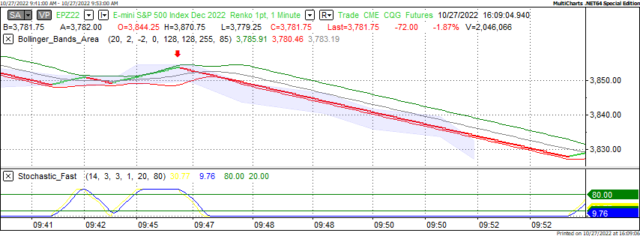
S&P – Dec 2022 – 10/27/22
Bias
Yesterday we gave the markets a Neutral or Mixed bias as we saw no evidence of Market Correlation at all. The Dow traded Higher by 194 points, however the other indices traded Lower resulting in a Mixed market at the close. Today we aren’t dealing with a correlated market and our bias is Neutral.
Could this change? Of Course. Remember anything can happen in a volatile market.
Commentary
So, when we viewed the market early Thursday morning, our first reaction was Mixed market as we saw no real evidence of correlation yesterday morning. The Dow traded Higher, but the other indices traded Lower, resulting in a Mixed market. Today we have Personal Income and Personal Spending, both of which are major and proven market movers. The surprise yesterday came in the form of Advance GDP which came in higher than expected. Any positive news in this market is well received.
 previous

