Skip to content

Interstellar Group

As a complicated financial trading product, contracts for difference (CFDs) have the high risk of rapid loss arising from its leverage feature. Most retail investor accounts recorded fund loss in contracts for differences. You should consider whether you have developed a full understanding about the operation rules of contracts for differences and whether you can bear the high risk of fund loss.    

Jobs Friday [Video]

ISG
notice

We strongly suggest you to follow our marketing announcements

.right_news

A WORLD LEADER

IN FX & CFD TRADING

Market
News

24 hours global financial information and global market news

A WORLD LEADER

IN FX & CFD TRADING

Sponsorship &
Social Responsibility

InterStellar Group aims to establish itself as a formidable company with the power to make a positive impact on the world.
We are also committed to giving back to society, recognizing the value of every individual as an integral part of our global community.

A WORLD LEADER

IN FX & CFD TRADING

การสัมนาสดเกี่ยวกับฟอเร็กซ์

A WORLD LEADER

IN FX & CFD TRADING

05

2023-02

Date Icon
2023-02-05
Market Forecast
Jobs Friday [Video]

US Dollar: Mar ’23 USD is Down at 101.435.

Energies: Mar ’23 Crude is Down at 75.84.

Financials: The Mar ’23 30 Year T-Bond is Up 3 ticks and trading at 131.28.

Indices: The Mar ’23 S&P 500 Emini ES contract is 108 ticks Lower and trading at 4164.25.

Gold: The Apr’23 Gold contract is trading Down at 1930.00. Gold is 8 ticks Lower than its close.

Initial conclusion

This is not a correlated market. The dollar is Down, and Crude is Down which is not normal, and the 30 Year T-Bond is trading Higher. The Financials should always correlate with the US dollar such that if the dollar is lower, then the bonds should follow and vice-versa. The S&P is Lower, and Crude is trading Lower which is not correlated. Gold is trading Lower which is not correlated with the US dollar trading Down. I tend to believe that Gold has an inverse relationship with the US Dollar as when the US Dollar is down, Gold tends to rise in value and vice-versa. Think of it as a seesaw, when one is up the other should be down. I point this out to you to make you aware that when we don’t have a correlated market, it means something is wrong. As traders you need to be aware of this and proceed with your eyes wide open. Currently Asia is trading Higher with th exception of the Hang Seng and Shanghai exchanges. All of Europe is trading Lower with the exception of the London exchange. .

Possible challenges to traders today

  • Average Hourly Earnings m/m is out at 8:30 AM EST. Major.

  • Non-Farm Employment Change is out at 8:30 AM EST. Major.

  • Unemployment Rate is out at 8:30 AM EST. Major.

  • Final Services PMI is out at 9:45 AM EST. This is Major.

  • ISM Services PMI is out at 10 AM EST. This is Major.

Treasuries

Traders, please note that we’ve changed the Bond instrument from the 30 year (ZB) to the 10 year (ZN). They work exactly the same.

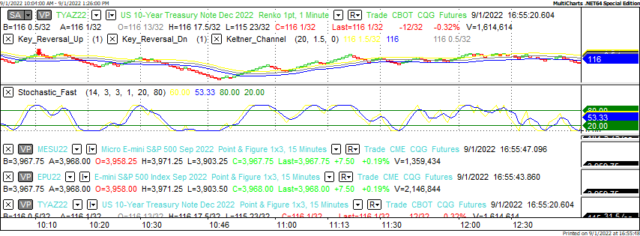
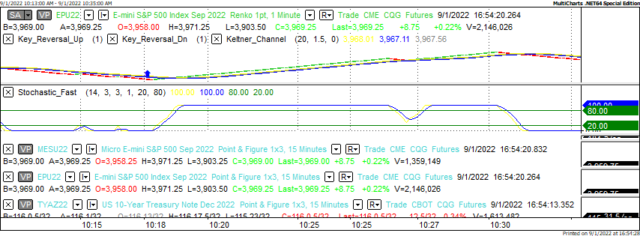
We’ve elected to switch gears a bit and show correlation between the 10-year bond (ZN) and the S&P futures contract. The S&P contract is the Standard and Poor’s, and the purpose is to show reverse correlation between the two instruments. Remember it’s likened to a seesaw, when up goes up the other should go down and vice versa.

Yesterday the ZN hit a High at around 12:30 PM EST. The S&P was trading Lower at around the same time. If you look at the charts below ZN gave a signal at around 12:30 PM and the S&P gave a signal at around the same time. Look at the charts below and you’ll see a pattern for both assets. ZN hit a High at around 12:30 PM and migrated Lower. These charts represent the newest version of MultiCharts and I’ve changed the timeframe to a 15-minute chart to display better. This represented a Short opportunity on the 10-year note, as a trader you could have netted about 20 plus ticks per contract on this trade. Each tick is worth $15.625. Please note: the front month for the ZN is now Mar ’23. The S&P contract is now Mar’ 23 as well. I’ve changed the format to filled Candlesticks (not hollow) such that it may be more apparent and visible.

Charts courtesy of MultiCharts built on an AMP platform

TYAH

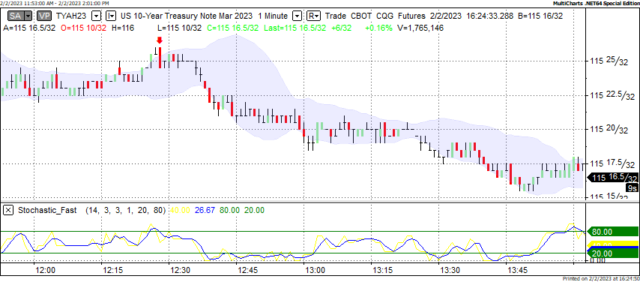
ZN – Mar 2023 – 2/2/23

TYAH

S&P – Mar 2023 – 2/2/23

Bias

Yesterday we gave the markets an Upside bias as both the USD and the Bonds were Lower Thursday morning, and this usually represents an Upside Day. We were mainly correct in that the S&P and Nasdaq traded Higher; the Dow traded Lower by 39 points. Given that today is Jobs Friday we will maintain a Neutral Bias as teh markets have never shown any sense of normalcy on this day.

Could this change? Of Course. Remember anything can happen in a volatile market.

Commentary

Yesterday we suggested an Upside Day but as the song goes two out of three ain’t bad. The Dow traded Lower, but the S&P and Nasdaq did close Higher. Today is the first Non-Farm Payroll report for 2023, so the question is can this set the tone for the year? We will maintain a Neutral Bias as the markets have never shown any normalcy on this day. Hopefully it is positive and moves the markets forward.

US Dollar: Sep '22 USD is Down at 109.315.

Energies: Oct '22 Crude is Up at 88.58.

Financials: The Dec '22 30 Year bond is Up 1 tick and trading at 133.19.

Indices: The Sep '22 S&P 500 Emini ES contract is 4 ticks Higher and trading at 3969.75.

Gold: The Dec'22 Gold contract is trading Up at 1717.30. Gold is 80 ticks Higher than its close.

Initial conclusion

This is not a correlated market. The dollar is Down, and Crude is Up which is normal, but the 30-year Bond is trading Higher. The Financials should always correlate with the US dollar such that if the dollar is lower, then the bonds should follow and vice-versa. The S&P is Higher, and Crude is trading Higher which is not correlated. Gold is trading Higher which is correlated with the US dollar trading Down. I tend to believe that Gold has an inverse relationship with the US Dollar as when the US Dollar is down, Gold tends to rise in value and vice-versa. Think of it as a seesaw, when one is up the other should be down. I point this out to you to make you aware that when we don't have a correlated market, it means something is wrong. As traders you need to be aware of this and proceed with your eyes wide open. Asia is trading mainly Lower with the exception the Shanghai exchange which is fractionally Higher. Currently all of Europe is trading Higher.

Possible challenges to traders today

  • Average Hourly Earnings is out at 8:30 AM EST. This is Major.

  • Non-Farm Employment Change is out at 8:30 AM EST. Major

  • Unemployment Rate is out at 8:30 AM. This is Major.

  • Factory Orders are out at 10 AM EST. Major.

Treasuries

Traders, please note that we've changed the Bond instrument from the 30 year (ZB) to the 10 year (ZN). They work exactly the same.

We've elected to switch gears a bit and show correlation between the 10-year bond (ZN) and the S&P futures contract. The S&P contract is the Standard and Poor's, and the purpose is to show reverse correlation between the two instruments. Remember it's likened to a seesaw, when up goes up the other should go down and vice versa.

Yesterday the ZN made its move at around 10:10 AM EST. The ZN hit a High at around that time and the S&P moved Higher shortly thereafter. If you look at the charts below ZN gave a signal at around 10:10 AM EST and the S&P moved Higher at around the same time. Look at the charts below and you'll see a pattern for both assets. ZN hit a Low at around 10:10 AM EST and the S&P was moving Higher shortly thereafter. These charts represent the newest version of MultiCharts and I've changed the timeframe to a 15-minute chart to display better. This represented a Short opportunity on the 10-year note, as a trader you could have netted about 20 ticks per contract on this trade. Each tick is worth $15.625. Please note: the front month for the ZN is now Dec '22. The S&P contract remains is Sep' 22 for the time being. I've changed the format to Renko Bars such that it may be more apparent and visible.

Charts courtesy of MultiCharts built on an AMP platform

TYA

ZN – Dec 2022 – 09/01/22

EPU

S&P – Sep 2022 – 09/01/22

Bias

Yesterday we gave the markets a Neutral bias as we didn't see much in the way of correlation Thursday morning. The markets traded Mixed as the Dow gained 146 points and the S&P gained 12 but the Nasdaq dropped 31 points. Given that today is Jobs Friday our bias is Neutral.

Could this change? Of Course. Remember anything can happen in a volatile market.

Commentary

Yesterday morning, as we reviewed the markets, the first thought crossing our minds, was “another down day.” We didn't see much in the way of correlation, and we gave the markets a Neutral or Mixed bias. The markets closed Mixed as the Dow and S&P gained but the Nasdaq dropped. We were tempted to call this edition “Finally” as it took a week to finally close somewhat Higher. Today is Jobs Friday and as such our bias is Neutral and it is also Labor Day weekend, which means our next edition will be Tuesday. We always maintain a Neutral bias on Jobs Friday as historically speaking the markets have never had any sense of normalcy on that day. Could this change? Of course. Much of what happens today will be predicated upon the Jobs report out at 8:30 AM EST.

Latest
NEWS