
- AUD/USD traded in an inconclusive note on Tuesday.
- Further losses could refocus on the 2024 low near 0.6450.
- Commodities and China keep the AUD under scrutiny.
The Australian dollar resumed the upward trend following a negative start to the week, prompting AUD/USD to chart humble gains around the mid-0.6500s
The slight uptick in AUD/USD occurred despite the equally marginal advance in the Greenback, as well as the continuation of the intense sell-off in iron ore prices, which reached multi-month lows near the $126.00 yardstick in response to increasing inventories and heightened uncertainty surrounding the Chinese housing market.
Spot price movements also mirrored the lacklustre performance of the US Dollar, as investors continued to assess the probability of the Federal Reserve (Fed) initiating monetary easing around June or later. This assessment gained traction following the release of strong US inflation data, coupled with persistently hawkish remarks from select Fed officials.
Despite the recent recovery of the currency pair, investors are expected to closely monitor developments in China, fluctuations in commodity prices (particularly copper and iron ore), and movements in the Greenback.
While potential additional stimulus measures in China could provide temporary support for a rebound, news indicating a more sustainable recovery in the country is essential for offering stronger support to the Australian dollar and potentially triggering a more significant upward movement in AUD/USD. An upswing in the Chinese economy is also anticipated to coincide with a rise in commodity prices, further bolstering the AUD.
Regarding the Reserve Bank of Australia (RBA), the cautious approach from the central bank is likely to prevent significant downward pressure on the Australian dollar, as it is considered one of the latest G10 central banks to commence its interest rate cuts process.
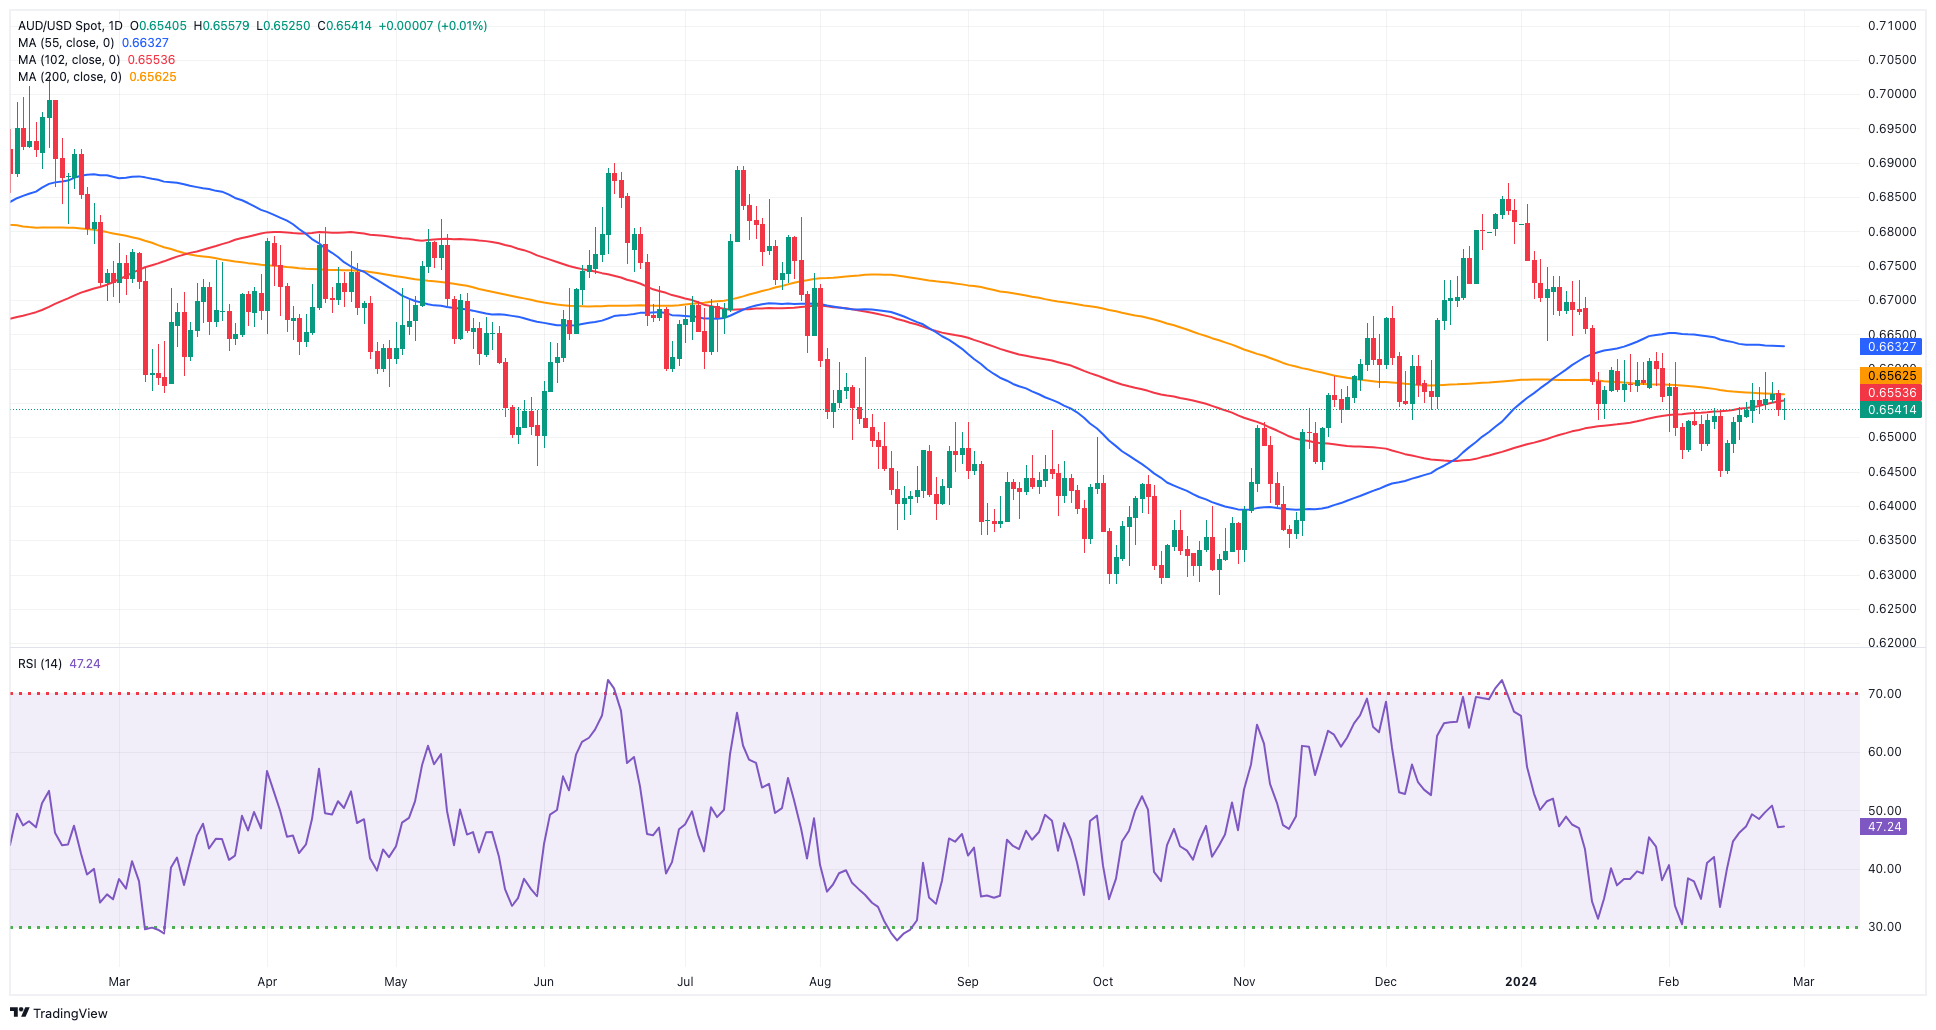
AUD/USD daily chart
 AUD/USD short-term technical outlook
 AUD/USD short-term technical outlook
After clearing the weekly high of 0.6595 (February 22), AUD/USD may retest the temporary 55-day SMA around 0.6627, which coincides with the late-January peaks (January 30). A break above this range may send the pair to the December 2023 top of 0.6871 (December 28), seconded by the July 2023 peak of 0.6894 (July 14) and the June 2023 high of 0.6899 (June 16), all before the critical 0.7000 barrier.
On the other side, bearish moves may cause spot to initially hit its 2024 bottom of 0.6452 (February 13). Breaking below this level might result in a return to the 2023 low of 0.6270 (October 26), followed by the round level of 0.6200 and the 2022 low of 0.6169 (October 13).
It is worth noting that for the AUD/USD to experience more short-term gains, it must first leave behind the critical 200-day SMA, which is currently at 0.6560, in a sustained manner.
The four-hour chart suggests that the consolidative attitude will persist for the time being. The initial resistance level is 0.6595, followed by 0.6610. Surpassing this zone suggests a potential development to 0.6728. Meanwhile, a breach of 0.6442 may result in a potential drop to 0.6347, then 0.6338. The MACD eased to the zero line, while the RSI retreated to the sub-50 area.
 previous

