
- Gold price corrects further from two-week highs of $2,041 early Monday.
- US Dollar rebounds amid risk-aversion, despite falling US Treasury bond yields.
- Gold price could see a pullback after closing the week above the key 50-day SMA at $2,033.
Gold price is reversing a part of the previous week’s advance to two-week highs of $2,041 in Asian trading on Monday. Resurgent US Dollar demand and tepid risk sentiment are aiding the correction in Gold price.
The downside in Gold price, however, could remain cushioned by the extended fall in the US US Treasury bond yields.
Gold price stays defensive amid a quiet start to the week
The US Dollar is drawing fresh haven demand, courtesy of fresh weakness in the Chinese stock markets, as geopolitical tensions resurface between China and Taiwan, as well as between Washington and Beijing.
China’s Commerce Ministry said on Monday, “the US falsely claims that China has created ‘overcapacity’, which fully reflects the US side’s unilateralism and hegemonic behavior.” Separately, China’s authorities said that the Fujian Coast Guard is boosting patrols in waters near Taiwan’s Kinmen islands “to strengthen law enforcement inspections in key areas.”
Investors also trade with caution ahead of a data-packed US calendar, with the Durable Good Orders data and the PCE inflation report to hog the limelight amid delayed Federal Reserve (Fed) interest rate cut bets. Markets are currently pricing in just about a 20% chance that the Fed could begin easing rates in May, much lower than an over 90% chance a month ago, according to the CME FedWatch Tool. For the June meeting, the probability for a rate cut now stands at about 70%, down from 77% seen a few days ago.
The recent conflicting messages from Fed policymakers combined with mixed US economic data prompt traders to take profits on their US Dollar positions before the release of a fresh bunch of key statistics from the US this week. Last week, S&P US Global Manufacturing PMI rose to 51.5 from 50.7 in February while S&P Global Services PMI edged lower to 51.3 from 52.5.
Further, risk-aversion has fuelled a fresh surge in demand for the US government bond, contributing to the extended weakness in the US Treasury bond yields across the curve. Softer US Treasury bond yields help limit the Gold price correction.
In the day ahead, the dynamics of the US Dollar and the US Treasury bond yields alongside risk trends will influence the Gold price action, as traders look to the US New Home Sales data for some trading incentives.
Gold price technical analysis: Daily chart
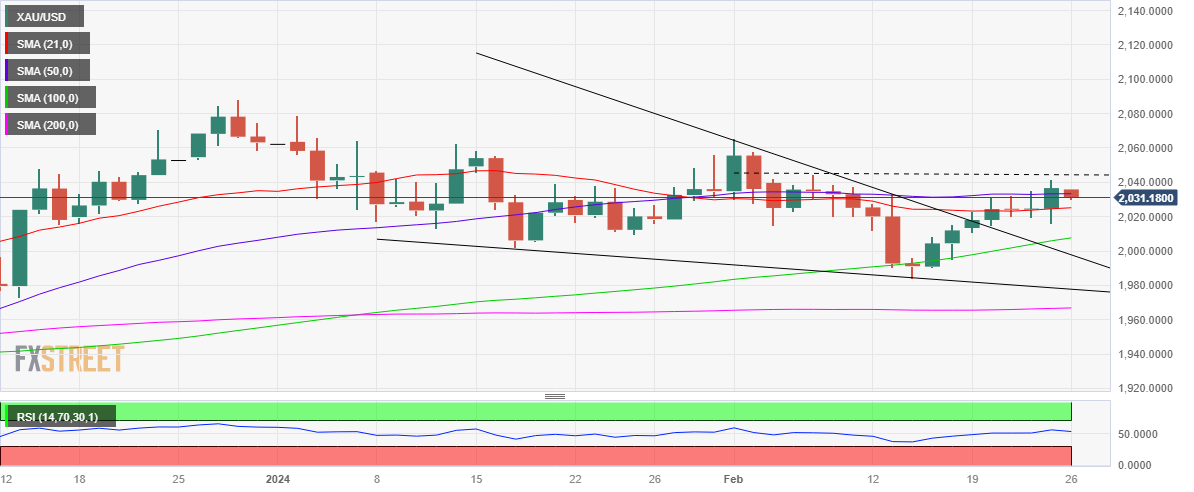
The short-term technical outlook for Gold price remains constructive but a brief pullback cannot be ruled out in the upcoming sessions.
The bright metal yielded a weekly closing above the crucial 50-day Simple Moving Average (SMA) hurdle at $2,033, keeping the bullish potential intact, backed by a falling wedge breakout seen last week.
The 14-day Relative Strength Index (RSI), however, is inching lower to challenge the midline, justifying the latest leg down in Gold price.
The immediate support is now seen at the 21-day SMA at $2,025, A failure to defend the latter could fuel a fresh downswing toward $2,007, the upwsrd-pointing 100-day SMA.
Ahead of that, Friday’s low of $2,016 could come to the rescue of Gold optimists.
On the flip side, if Gold buyers fight back control, recapturing the 50-day SMA will be critical to targeting the February 7 high of $2,044 once again.
The next upside barrier for Gold price is then seen at the $2,050 psychological barrier.
 previous

