
- AUD/USD bounced off yearly lows near 0.6440.
- The Dollar’s knee-jerk favoured the risk complex.
- The upcoming Australian jobs report gathers all the attention.
The Australian dollar managed to regain some composure and rebounded from Tuesday’s yearly lows near the 0.6440 region vs. the US Dollar (USD), re-shifting its attention to a potential test of the key 0.6500 zone in the short term.
The daily bounce in AUD/USD came in tandem with the inconclusive session in the Greenback amidst further investors’ reassessing of a potential start of the Fed’s easing cycle in June, a view that was strengthened further after sticky US inflation figures in January.
Despite the ongoing recovery in the pair, Tuesday’s significant retracement to new yearly lows opened the possibility of further near-term weakness in the Aussie dollar, always in response to dynamics around the US Dollar, the ongoing yearly decline in copper and iron ore prices, and persistent uncertainty surrounding the Chinese economy.
On a positive note, the recent hawkish stance maintained by the Reserve Bank of Australia (RBA), coupled with a tight labour market and robust fundamentals, should somewhat mitigate downward pressure on the Australian currency.
Following the Reserve Bank of Australia’s (RBA) hawkish hold at its February meeting, it appears that the bank’s stance could somehow limit the downside potential in spot for the time being.
In addition, it is worth mentioning that the RBA’s Statement on Monetary Policy (SoMP) adjusted the bank’s inflation forecasts downward, anticipating both indicators to remain below 3% by the fourth quarter of 2025. Additionally, the RBA revised its GDP growth projections lower, reflecting a less optimistic outlook for short-term consumer spending and housing investments.
AUD/USD daily chart
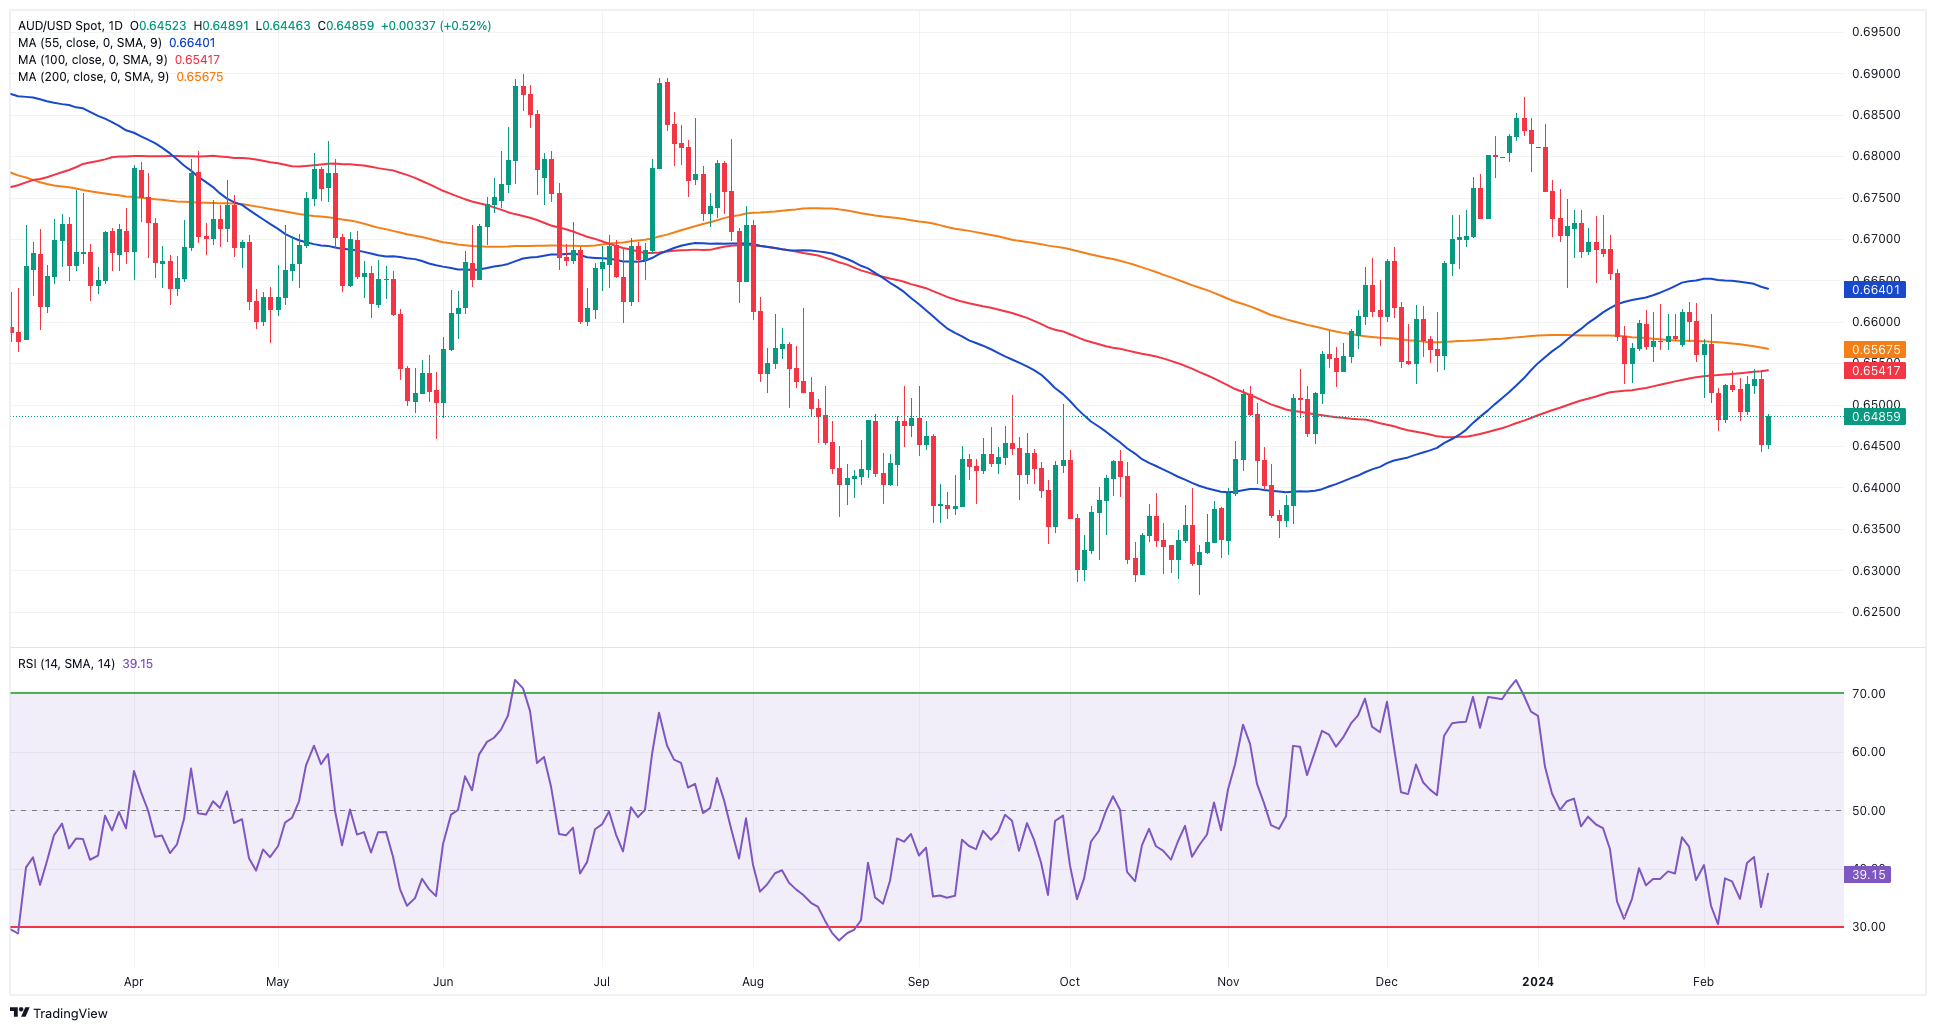
AUD/USD short-term technical outlook
The resurgence of selling pressure may prompt AUD/USD to initially test its 2024 low of 0.6452 (February 13). Breaching this level could potentially lead to a retest of the 2023 low of 0.6270 (October 26), followed by the psychological level of 0.6200 and the 2022 low of 0.6169 (October 13).
On the upside, the significant 200-day Simple Moving Average (SMA) at 0.6566 stands out as the next target to monitor, followed by the intermediate 55-day SMA at 0.6635. A breakout above this range may prompt the pair to challenge the December 2023 top of 0.6871 (December 28), followed by the peaks of July 2023 at 0.6894 (July 14) and June 2023 at 0.6899 (June 16), all preceding the pivotal 0.7000 threshold.
It’s important to emphasize that for AUD/USD to see further short-term gains, it needs to convincingly surpass the key 200-day SMA.
On the 4-hour chart, there are indications of an incipient recovery in the near term. Meanwhile, breaching 0.6442 could lead to a decline towards 0.6347 and then 0.6338. On the bullish side, immediate resistance lies at 0.6610, followed by the 200-SMA at 0.6613. Surpassing this zone suggests a potential advance towards 0.6728. The MACD retreated to the negative zone, while the RSI climbed past the 45 mark.
 previous

